

-

交流
结识当地开发者和技术专家。我们欢迎各类人士,包括具有不同背景和来自各个公司和行业的人士。 -

学习
参加线上和线下的实践研讨会、培训、活动、讲座和聚会,了解各种技术主题并习得新技能。 -

成长
运用您的知识和人脉,打造卓越产品、提升技能、促进职业发展并拓展关系网。您还可以帮助他人学习新技能,以此回馈您的社区。
社区
搜索目录,查找您附近的 Google 开发者社区。访问每个 Google 开发者社区的页面,了解社区和活动的相关详情以及申请方式。
来自社区的故事
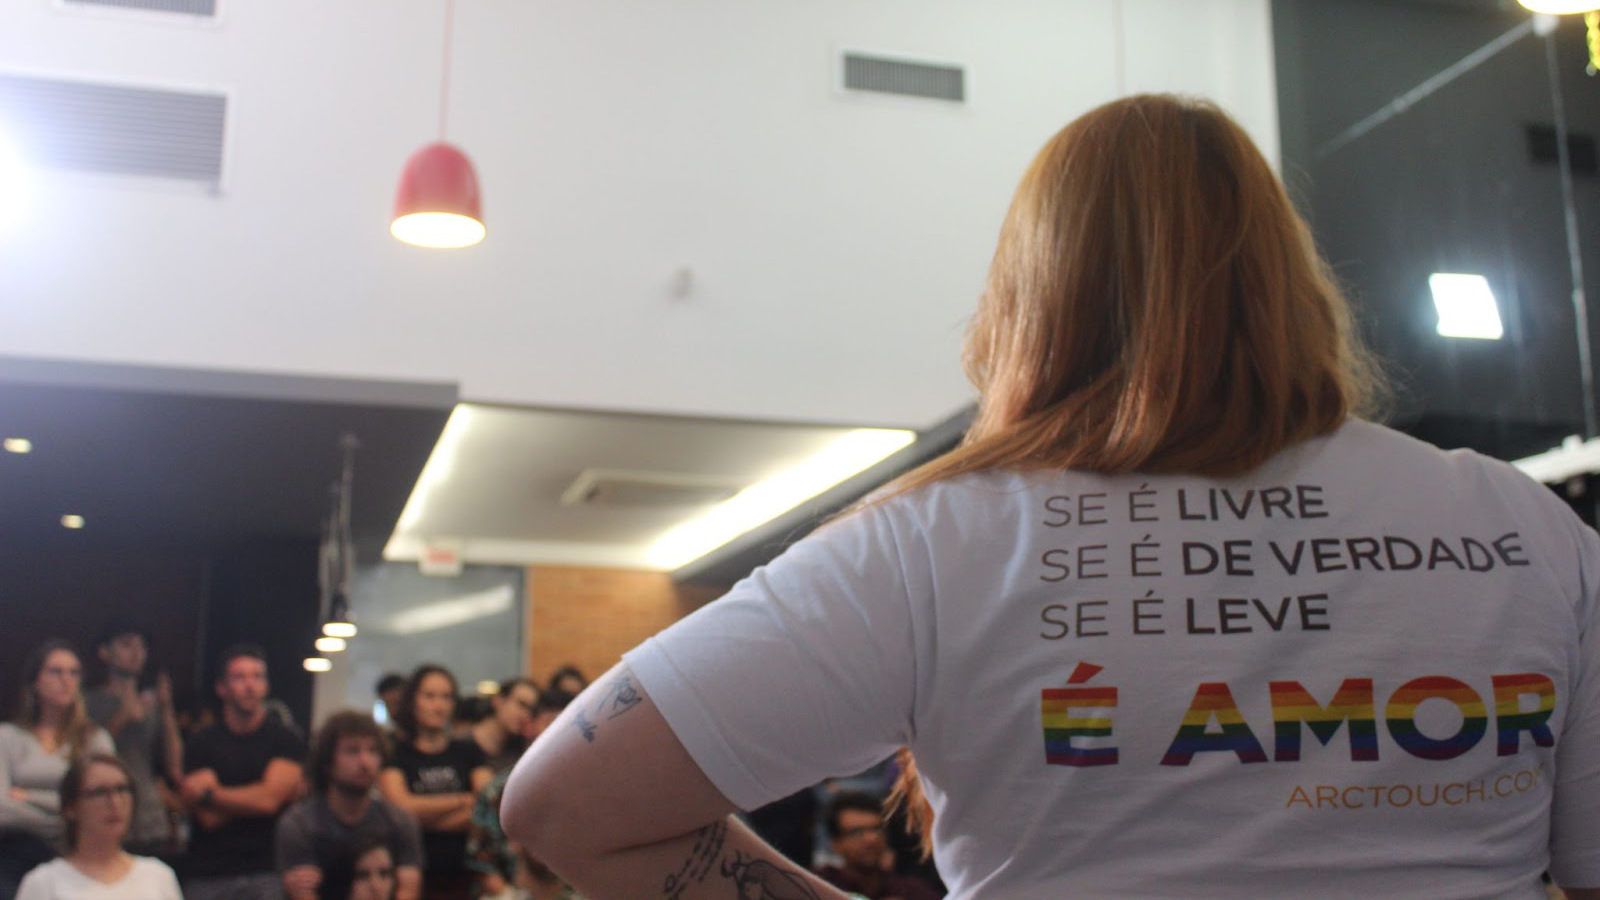
巴西 Google 开发者社区的同志骄傲周活动
2021 年 6 月
作为 Women Techmakers 大使和巴西弗洛里帕的 Google 开发者社区领头人,Lorena 与当地社区合作举办了为期一周的特殊活动(包括超过 12 场讲座和会议),目的是改善 LGBTQIA+ 人群在技术领域的状况。
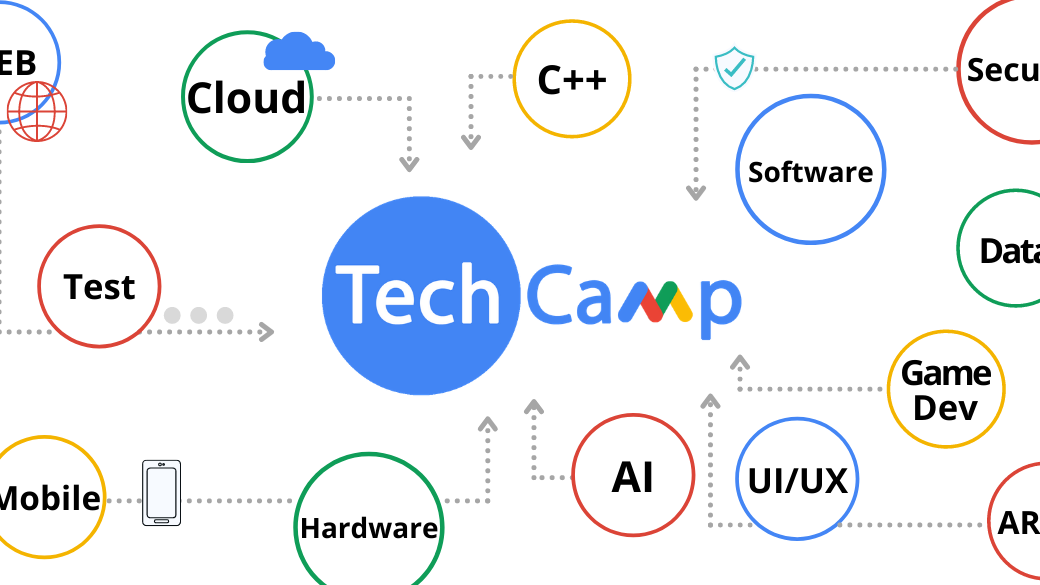
开展技术职业培训的佐治亚州技术夏令营
2021 年 5 月
我们致力于让所有需要的人都能获得 Android 开发培训,这样任何人都可以成为 Android 开发者。这些年来,有数百万不同水平的学员学过我们的内容,并通过课程和 Codelab 实践提升了自己的技能。随着行业的不断发展,我们会一如既往地更新已有内容和发布新内容。
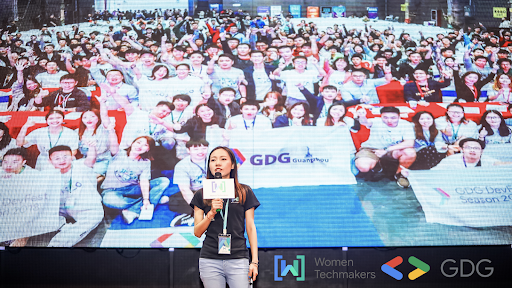
与广州开发者 Hebe He 的对话
2021 年 5 月
我们继续深入了解各 Google 开发者社区的组织和发展方式,并采访了中国广州 Google 开发者社区的组织者 Hebe He。详细了解她如何在中国打造开发者社区,并为其社区策划新活动。
分享您的故事
分享您的故事,即有机会出现在 Google 视频、博客或社交媒体帖子中。
在某些国家/地区(例如克里米亚、古巴、伊朗、朝鲜和叙利亚),Google 限制用户使用其部分服务。